Blogs
Shear-wave velocity imaging of weathered granite in La Campana (Chile) from Bayesian inversion of micro-tremor H/V spectral ratios
29 September 2023
By: Rahmantara Trichandi
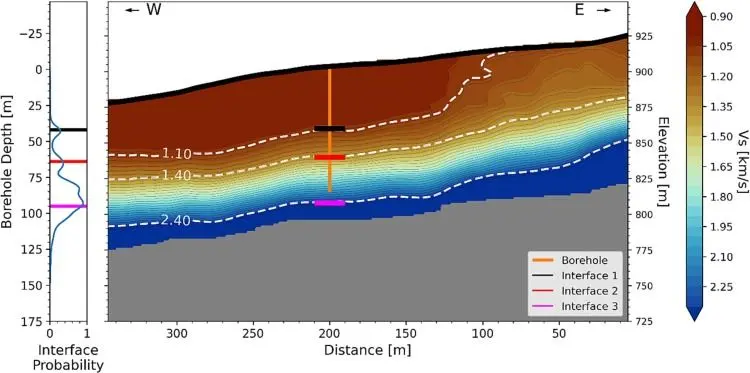
Subsurface imaging of the regolith layer is an important tool for weathering zone characterization. For example, the extent of bedrock modification by weathering processes can be modelled by means of differing seismic velocities. We acquired a 360 m-long seismic profile in central Chile to characterise weathering at a semi-arid site. We used 87 3-component geophones, which continuously recorded ambient seismic noise for three days. The seismic line was centered at an 88 m deep borehole, providing core and downhole logging data for calibration. We extract Horizontal-to-Vertical Spectral Ratio (HVSR) curves along the seismic line to image the subsurface. Temporal analysis of the HVSR curves shows that the ambient noise vibrations recorded during the nighttime provide more stable HVSR curves. The trans-dimensional Bayesian Markov chain Monte Carlo (McMC) approach was used to invert the micro-tremor HVSR curves at each station to reconstruct 1D shear-wave velocity (Vs) models. The resulting individual 1D Vs models were merged to create a 2D Vs model along the linear seismic array in La Campana. The resulting Vs model shows an increase from 0.85 km/s at the surface to ca. 2.5 km/s at 100 m depth. We use the interface probability as a by-product of the Bayesian inversion to apply a more data-driven approach in identifying the different weathering layers. This method identified the boundary between saprolite and fractured bedrock at 42 m depth at the borehole, as evidenced by the interpretation of downhole logging data such as magnetic susceptibility.
The resulting 2D Vs model of this site in Mediterranean climate shows a strong correlation between the interpreted weathering front at around 90-m depth and a higher precipitation rate in the study site compared to arid sites. The horizontal alignment of the weathering front indicates a correlation between the weathering front depth with topography and fractures in the bedrock.
Application of Particle Swarm Optimization for Physical Property Estimation
20 June 2023
By: Mordekhai
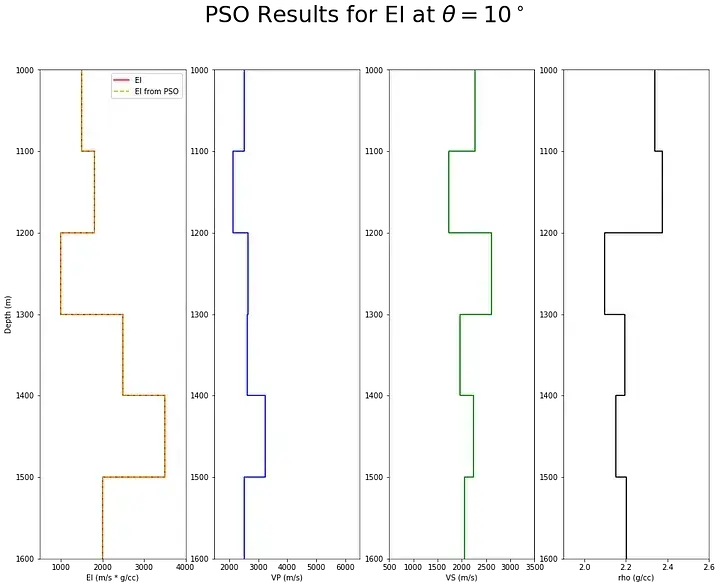
Particle Swarm Optimization (PSO) is an inverse modeling optimization technique inspired by the collective behavior of social organisms, such as bird flocking or fish schooling. It has been widely applied in solving complex optimization problems across different fields. The algorithm maintains a set of candidate solutions and iteratively improves upon them. At each iteration, the particles evaluate their fitness based on an objective function and update their position and velocity based on their own experience and the experience of their neighbors. When applied to the elastic impedance equation, PSO can help determine the most suitable values for Vp and Vs that best fit the observed seismic data.
Ant Colony Optimization for Finding the Optimal Well Trajectory
02 March 2023
By: Mordekhai
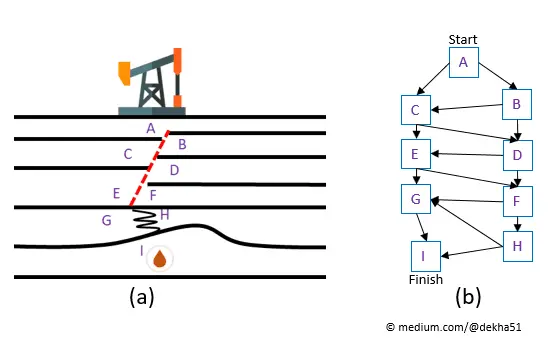
Ant-Colony Optimization (ACO) is a Bio-inspired computational technique that uses the behavior of ant colonies to solve optimization problems. ACO takes advantage of probabilities in the behavior of ant colonies in finding food sources. ACO is often employed to address intricate discrete optimization issues.
In this article, we will use ACO to find the optimal well trajectory based on Point-to-Point Distance (m) and Unconfined Compression Strength (UCS (KPa). UCS is a measure of the maximum stress that a rock sample can withstand before it fails. A high UCS value indicates that the rock is more resistant to deformation and can sustain higher loads without failing, which is indicative of a harder rock. On the other hand, a low UCS value indicates that the rock is less resistant to deformation and can fail at lower loads, which is indicative of a softer rock.
Semi-Supervised Outlier Detection Using PyOD
09 January 2023
By: Mordekhai
Outlier detection is a crucial step in many data science problems in any field. A lot of outlier detection methods have developed and applied in real life, ranging from univariate descriptive statistics to the use of machine learning/deep learning for multivariate outlier detection.
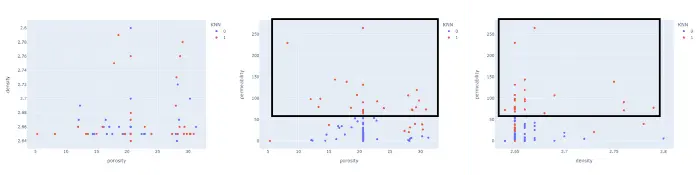
In this article, we will focus on utilizing various machine learning methods to perform outlier detection in multivariate data. PyOD is the main library used in this article because of its ease in applying various methods according to their respective characteristics.
This article will also introduce Semi Supervised method for anomaly detection, including its application on porosity, permeability and density data.