Publications
Ground-Penetrating Radar and Electrical Resistivity Tomography for Nickel Laterite Exploration: A Case Study in North Konawe, Indonesia
Authors: Muhammad A. Wicaksono, Fahriansyah, Mordekhai, Wahyudi W. Parnadi, Ardi S. Rahmat, Yusuf Darnanto, I Gede E. Wardana
2023-01-23
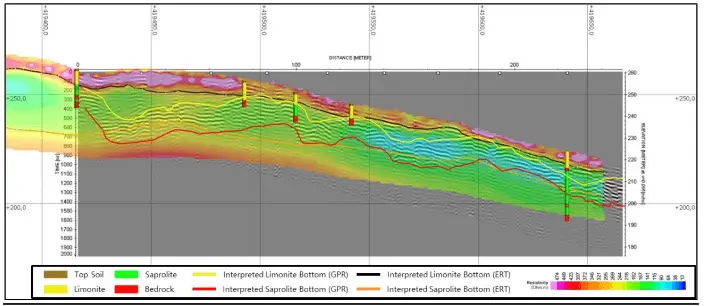
With the increasing demand of batteries for electrical vehicle in world, the interest of nickel laterite exploration and then its exploitation grow significantly. Nickel ore is one of the raw materials for making these batteries, which has high economic values, and is widely found in Indonesia. Therefore, extensive nickel exploration in Indonesia is highly required to obtain the estimation of its potential resources. Until now, data from boreholes near each other are used to calculate Nickel ore resources. To estimate the bedrock depth and horizontal variation between borehole data and therefore reducing operational costs, Ground-Penetrating Radar (GPR) and Electrical Resistivity Tomography (ERT) are the suitable methods for that purpose due to its cost and time effectiveness. In this research, we analyses several GPR profiles acquired with MALA Rough Terrain Antenna (RTA) 25 MHz antennas supported with ERT data in Antam exploration site in North Konawe, Southeast Sulawesi. Radar attributes are assigned after applying conventional processing steps.
From preliminary results and its comparison with ERT and borehole data as validation tool, we obtained interesting results about the boundaries of limonite, saprolite, and bedrocks.
Mineral Mapping on Hyperspectral Imageries Using Cohesion-based Self Merging Algorithm
Authors: A. Fakhrurrozi, M. R. Noor , I. Qudsi, A. M. Sari
2022-12-15
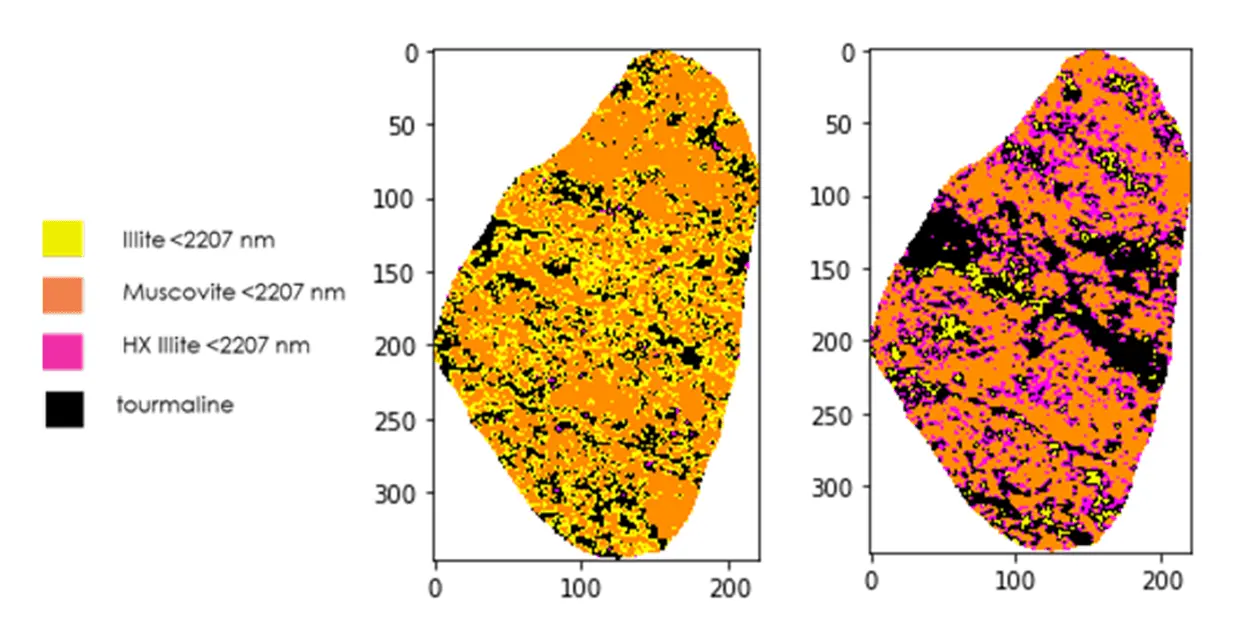
Recently, hybrid clustering algorithms gained much research attention due to better clustering resultsand are computationally efficient.Hyperspectral image classification studies should be no exception, including mineral mapping. This studyaims to tackle the biggest challenge of mapping the mineralogy of drill core samples, which consumes a lot of time.In this paper, we present the investigation using a hybrid clustering algorithm, cohesion-based self-merging (CSM), for mineral mapping to determine the number and location of minerals that formed the rock. The CSM clustering performance was then compared to its classical counterpart, K-means plus-plus (K-means++). We conducted experimentsusinghyperspectral imagesfrom multiple rock samples to understand how well the clustering algorithm segmentedminerals that exist inthe rock. The samples in this study contain minerals with identical absorption features in certain locations that increase the complexity. The elbow method and silhouette analysis did not perform well in deciding the optimum cluster sizedue to slight variance and high dimensionality of the datasets. Thus, iterations to the various numbersof 푘-clustersand 푚-subclustersof each rock wereperformed toget the mineral cluster. Both algorithms were able to distinguish slight variations of absorption features of any mineral.
The spectral variation within a single mineral found by our algorithm might be studied further to understand any possible unidentified group of clusters. The spatial consideration of the CSM algorithm induced several misclassified pixels. Hence, the mineral maps produced in this study are not expected to be precisely similar to ground truths.
Geoscience and earthquake insurance relation: a methodology to calculate premium based on density map of earthquake occurrence in West Java
Authors: Mordekhai, Faisal Anggoro
2019-11-01
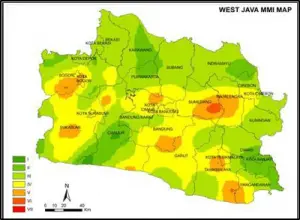
Earthquake insurance is an insurance that covers the risks that occur when buildings are damaged/destroyed due to an earthquake. In order to determine adequate premium for earthquake insurance, a grouping method based on building locations is needed. In Indonesia, the method for grouping the building locations is based on zones where several locations have not been classified to the district/municipality level. In other words, the zone grouping system still has a limited resolution. In addition to detailing the grouping, this paper also aims to make the level of earthquake vulnerability in West Java. The approach used is to make a density map based on earthquake intensity scale (MMI) and magnitude historical data. From these density map, the value of building exposure damage are calculated using the Mean Damage Ratio (MDR) parameter. This value is used as a pricing parameter for determining earthquake insurance premiums in more detail for each location. The results of this study indicate that the levels of damage to buildings are varied and earthquake insurance premiums have a high degree of non-uniformity in each municipality/district in this province.
Curie Point Depth Mapping Underneath Botswana for Geothermal Prospect Identification Using Aeromagnetic Data
Authors: Izzul Qudsi
2019-03-01
The East African Rift System (EARS) is widely recognized as a major tectonic system that has excellent geothermal resources. A recent study in southern Africa found that there might still be rifting in the Passarge Basin in central Botswana, suggesting that the East African Rift System (EARS) is extended. This research was done to examine the implication of the extension of the EARS to the geothermal prospect that could be used as the preliminary information for further exploration in Botswana.
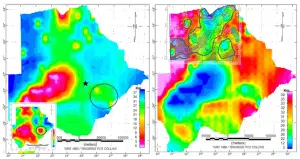
In this research, the Curie point depth (CPD) and heat flow map of Botswana were produced from aeromagnetic data. The method used was the spectral analysis (1DPSD) which considered as the ideal approach for a regional CPD study. This method has several parameters dependency, the pycurious algorithm was applied to overcome this issue. A window size 400 km with increments of 50 km was used in the algorithm to produce the CPD deeper than 40 km (based on the crustal thickness estimated in this region). The CPD and heat flow maps were compared to the existing geophysics and geological information to examine the implication of the extension of EARS to the geothermal prospect of Botswana. The prospective zones were delineated according to the heat flow value and the geological condition.
The result indicates that the CPD appears to be consistent with the previously published crustal thickness model for the northern part of Botswana. The shallower CPD zones (<15km) are coincident with the thinner crust zones from the model (<40 km). These zones were distributed along the geologically weak area, from the northern part which is represented by the Ghanzi-Chobe Belt to the south-western part represented by the Nosop Basin. The heat flow map created was able to distinguish the high heat flow (>65 mW/m2) area that was comparable to the heat flow value in the well-developed geothermal field in the western branch of EARS. Two prospective geothermal zones were identified based on the anomalous heat flow, divided by the possible tectonic condition that caused the anomaly. The first zone was interpreted as the result of the continuation of the EARS, the other zone was interpreted as the result of the older tectonic activity in Early Proterozoic era or the current tectonic activity as indicated by the recent earthquake in this area.
The Preliminary Results: Seismic Ambient Noise Rayleigh Wave Tomography Around Merapi Volcano, Central Java, Indonesia
Authors: Rahmantara Trichandi, Tedi Yudistira, Andri Dian Nugraha, Zulfakriza Zulhan, Erdinc Saygin
2015-04-24
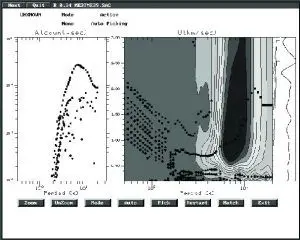
Ambient noise tomography is relatively a new method for imaging the shallow structure of the Earth subsurface. We presents the application of this method to produce a Rayleigh wave group velocity maps around the Merapi Volcano, Central Java. Rayleigh waves group velocity maps were reconstructed from the cross-correlation of ambient noise recorded by the DOMERAPI array which consists 43 broadband seismometers. In the processing stage, we first filtered the observation data to separatethe noise from the signal that dominated by the strong volcanic activities. Next, we cross-correlate the filtered data and stack to obtain the Green’s function for all possible station pairs. Then we carefully picked the peak of each Green’s function to estimate the dispersion trend and appliedMultiple Filter Technique to obtain the dispersion curve. Inter-station group velocity curvesare inverted to produceRayleigh wave group velocity maps for periods 1 to 10 s. The resulted Rayleigh group velocity maps show the interesting features around the Merapi Volcano which generally agree with the previous studies. Merapi-Lawu Anomaly (MLA) is emerged as a relatively low anomaly in our group velocity maps.